
The New My FS Flights: A Tour of the Rebuilt Flight Analysis and Landing Coach
Most landing-rate tools will tell you that you touched down at 87 feet per minute, but is it worth celebrating? It won't tell you that you crossed the threshold twelve knots fast, floated for two thousand feet burning off the excess, and put the wheels down with a third of the runway behind you. If you've been logging landings like this, or keeping a spreadsheet you abandoned after a fortnight, or flying for a virtual airline whose ACARS client records that you flew but not how, then you've been measuring either the wrong thing or nothing at all.
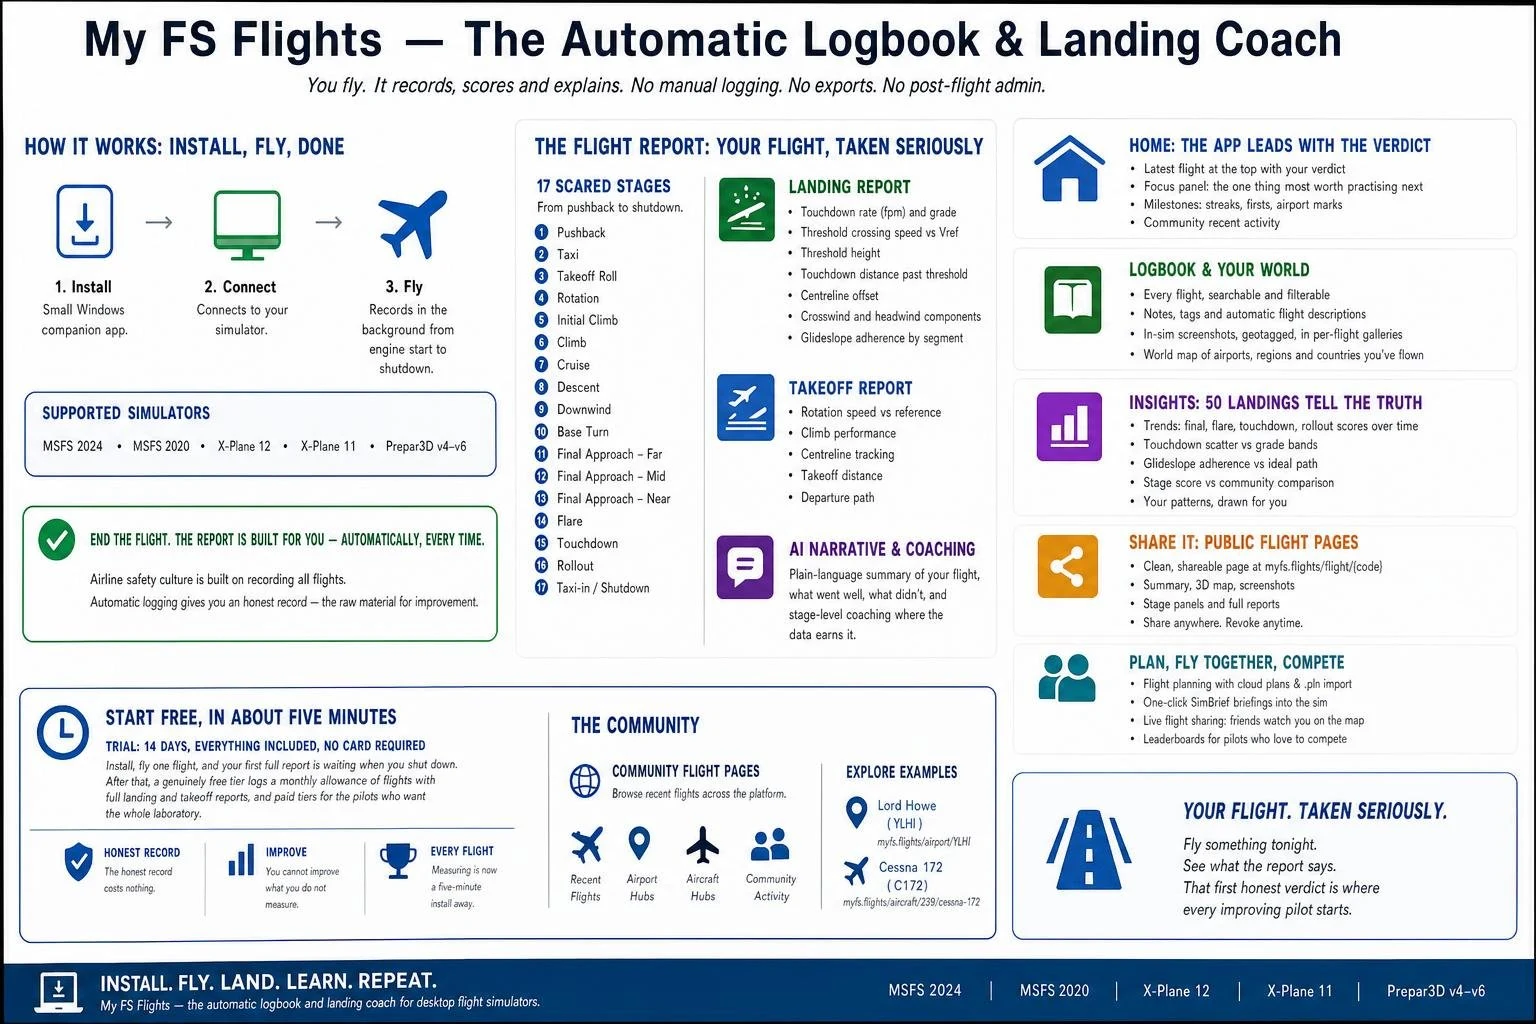
I rebuilt My FS Flights over the summer, and this is my tour of what it now does. An automatic logbook that records every flight in the background. Scored stages. A metric-level landing report. A plain-language debrief written from the data. And a permanent record of all of it, so you can see trends instead of highlights. I think the tour is worth reading even if you never install the thing, because every feature exists to answer a question about landing technique, and the questions can be more interesting than the software.
The idea airlines settled decades ago
Airlines stopped arguing about whether landings were good in roughly the way virtual pilots still argue about them. They started recording every flight automatically and looking at the data. The discipline is called FOQA, flight operational quality assurance, or flight data monitoring, and its central insight isn't technological. Feedback that arrives seconds after the behaviour changes the behaviour. Feedback that never arrives changes nothing. An unmeasured landing teaches you whatever you already believed about it.
The second insight of FOQA is subtler. It works not by punishing individual pilots for individual events but by showing a fleet its own distributions. The useful question isn't "was that landing good?" It's "where does that landing sit among the last fifty?" A single firm arrival means nothing. A slow drift of the whole fleet's touchdown points down the runway means something is wrong with how approaches are being flown, and it becomes visible months before it becomes an overrun.
My FS Flights is that logic applied to a desktop simulator. Everything else in this tour, the automatic recording, the stage scores, the landing report, the permanent logbook, is one of those two FOQA ideas dressed up as a feature. Fast, honest feedback on the single flight, and distributions across many.
Recording that asks nothing of you
The platform records through a small Windows companion application, the Client Connector, which sits in the background while you fly Microsoft Flight Simulator 2024 or 2020, X-Plane 12 or 11, or Prepar3D v4 through v6. There's no button to press before the flight, nothing to remember during it, and nothing to fill in afterwards. You fly, and the flight appears in your logbook, processed and scored. Recording and scoring work identically across all five simulators.
Automatic capture sounds like a convenience feature. I built it as a measurement feature, for two reasons.
First, manual logging dies. Anyone who has kept a spreadsheet logbook knows the shape of its death. Enthusiasm for two weeks, then a missed entry, then a backlog, then abandonment. A dataset with gaps you chose is worse than a small dataset, because the gaps aren't random. You skipped logging the flights you weren't proud of.
Second, and more important, memory crops. Ask yourself what your last flight was like and you'll recall the landing, perhaps the takeoff, and almost nothing of the forty minutes in between. Ask yourself how good your landings are and you'll recall your best ones, because those are the ones you screenshotted and posted. An automatic recorder captures the whole flight and every flight, which means the score reflects the departure you rushed and the descent you started late, not just the thirty seconds you'd have chosen to remember. I made it uncomfortable on purpose.
Stages, and why the whole flight is scored
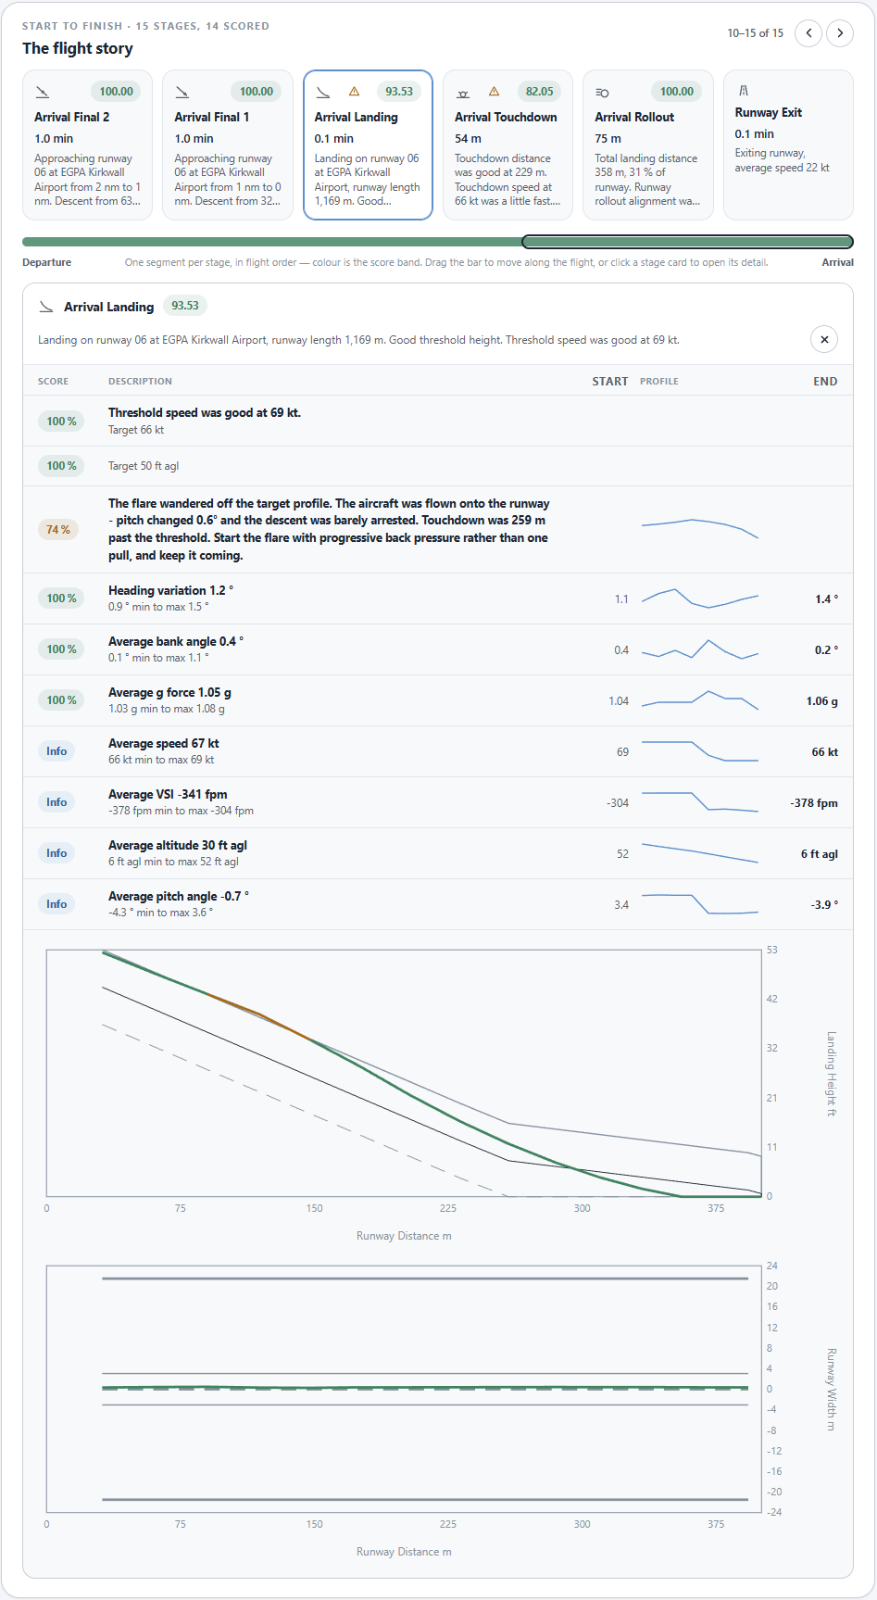
Each recorded flight is automatically split into detected stages. The platform works out where the taxi ended and the takeoff began, where the climb became the cruise, where the approach started, and it scores each stage. The stage scores roll up into Departure, Enroute and Arrival scores, and those into an overall Flight Score.
The point of scoring stages rather than just the landing is the cropping problem again. A hard landing frequently isn't a landing fault at all. It's an arrival fault that ran out of altitude. A pilot who only ever sees a touchdown number will practise the flare indefinitely when the actual problem is a descent that was never stabilised, and stage-level scoring is what makes that distinction visible. Which brings me to the landing report itself.
Inside the landing report
The landing report is the densest part of the platform, and each section measures something specific for a specific reason. Taking them in the order the aircraft encounters them.
The gates at 1,000 feet and 500 feet
The report awards a stabilised-approach badge assessed against five criteria by 1,000 feet and 50 feet. Gear down, flaps set, sink rate under control, on glideslope, on centreline. This mirrors industry practice, where Flight Safety Foundation guidance uses a 1,000 ft gate in instrument conditions and commonly allows 500 ft in visual conditions.
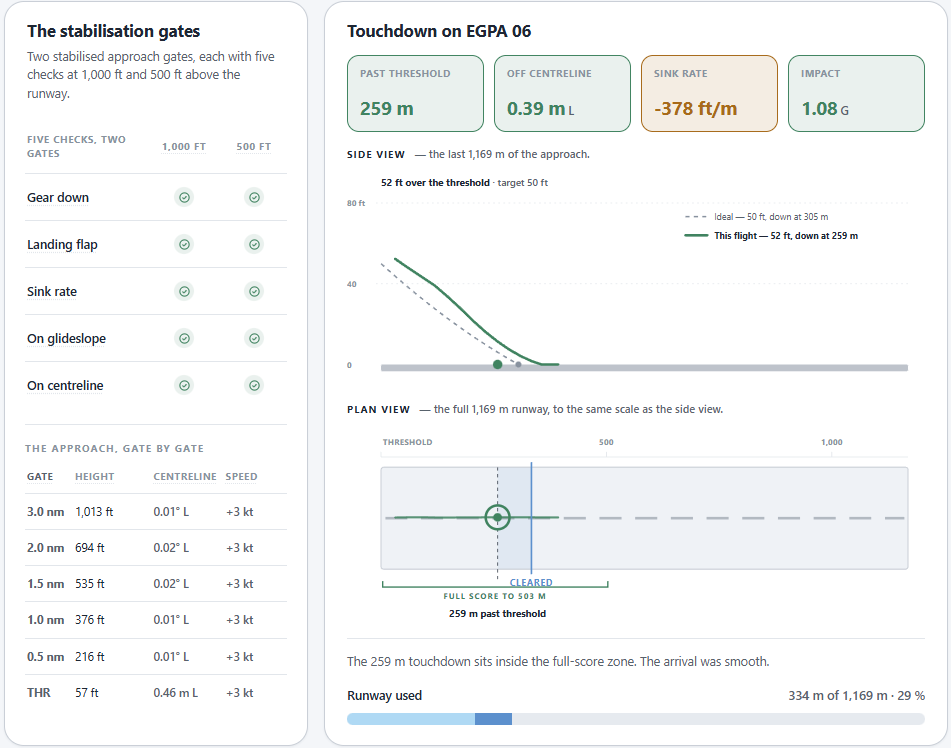
The gate isn't a rule for its own sake. It's a workload argument. The final thousand feet of an approach takes around a minute, and that minute is either spent refining the flare or spent fixing the configuration. An approach that is still changing gear, flap and speed inside 1,000 ft consumes its remaining time on corrections, and the landing gets whatever attention is left over, which is usually not much. Industry studies of approach-and-landing accidents consistently implicate unstabilised approaches, and consistently find that the large majority of unstable approaches are continued to a landing rather than abandoned. A measured badge makes each continuation visible and countable, which is the first step toward the go-around habit.
Go around detection
If your approach is not stable at the gates, then you have nothing to lose by going around and making sure your landing is successful. The flight recording will automatically detect a go around at any stage of the approach. Going around will only increase your score and save you from that embarrassing high and fast approach with that endless float down the runway.
Threshold checks
The report compares your speed crossing the threshold with VRef, the reference landing speed, classically defined as about 1.3 times the stall speed in landing configuration. Modern transport certification uses a slightly different factor on reference stall speed, but the idea is the same. I compare against VRef rather than a fixed number because the target moves with weight, with flap setting and with aircraft, and a fixed number would be wrong for most of them.
Threshold speed gets its own metric because energy at the threshold is the single best predictor of what the flare can achieve. Excess speed doesn't disappear. It has to be dissipated in float before the aircraft is slow enough to touch down, and float is measured in runway. A common rule of thumb puts roughly 10% excess speed over VRef at the threshold at something like 20% additional landing distance. A fast threshold crossing pre-writes a long landing before the flare has begun.
Your height crossing the threshold is also recorded and scored against an ideal height of 50 feet. Both the approach speed and height are critical in how the flare plays out.
Getting the flare right
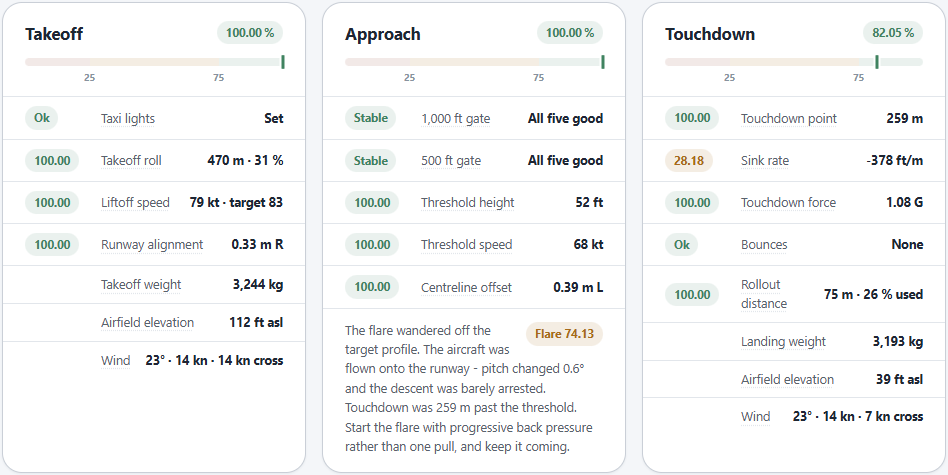
Getting the approach speed, threshold height and runway alignment right will give the best possible chance of executing the perfect flare. The flare is were the energy dissipates ensuring a small and event free contact with the runway surface. Too much energy and you might balloon or just land long, too little energy, might result in a heavy landing. My FS Flights analyses and scores this critical phase providing both descriptive and visual insight into how things really went in those last few seconds. This feedback helps you understand what happened for this landing with real context and also provides broader insights across all your flights to identify patterns and trends.
Pilots who land long and blame their flare technique are often looking at the wrong metric, with My SF Flights you will get the full picture.
Touchdown rate
The report gives an exact touchdown rate in feet per minute along with your lateral position on the runway. Your touchdown score is calculated relative to that rate of descent and adjusted for aircraft weight.
Touchdown rate matters more at a desk than in an aircraft. A real pilot feels a firm touchdown in their spine and a virtual pilot feels nothing, making the ability to rank the landings firmness very difficult. The measured number isn't a nice-to-have replacing a sensation you already had, it's the only version of that information you get.
Touchdown point
Touchdown rate and touchdown point trade against each other, and a report that shows both side by side reveals what a simple landing-rate never can. Whether a soft landing was bought with runway. The float-for-butter failure looks like this. The pilot arrives slightly fast, holds off in a long float bleeding speed, and is rewarded with 50 fpm but three thousand feet past the aim point. On this flight report, it's a long, fast landing that happened to end gently and not just a the touchdown point.
Conventionally the aim point sits at the 1,000 ft runway markers and the touchdown zone is commonly defined as roughly the first third of the runway or the first 3,000 ft. A touchdown inside the zone at 250 fpm is a better landing than a greaser beyond it and the report will say so.
Centreline and rollout
The report tracks lateral position through the flare, touchdown and the rollout, not just at the moment of contact, and this exposes crosswind faults that a touchdown snapshot hides. The two common failures leave different signatures. A crab that was never kicked off shows lateral offset growing before touchdown. Rudder released too early shows a small offset at touchdown that diverges through the rollout as the aircraft weathercocks.
Fifty landings instead of one
Everything above is the single-flight half of the FOQA idea. The other half is distributions, and this is where the permanent logbook stops being a diary and starts being an instrument.
One landing is weather plus luck. Fifty landings are a signal. A scatter of fifty touchdown rates and touchdown points says more than any individual report can, and some of the most useful patterns only exist at that scale.
- Consistently long touchdowns point at threshold speed, not flare technique. The fault is a habit on final, not a habit in the hold-off.
- Centreline scatter at touchdown points at decrab timing rather than approach tracking.
- Good landings following bad approaches are luck, and the distribution shows how often the luck holds, which tells you how long it will keep holding.
When you read a hard landing as "flared too late" when the data shows the sink rate was already excessive at 200 ft it will tell you to practise the wrong correction indefinitely, and get very good at a fix for a problem you don't have. Separating approach faults from flare faults is most of what I built the report to do.
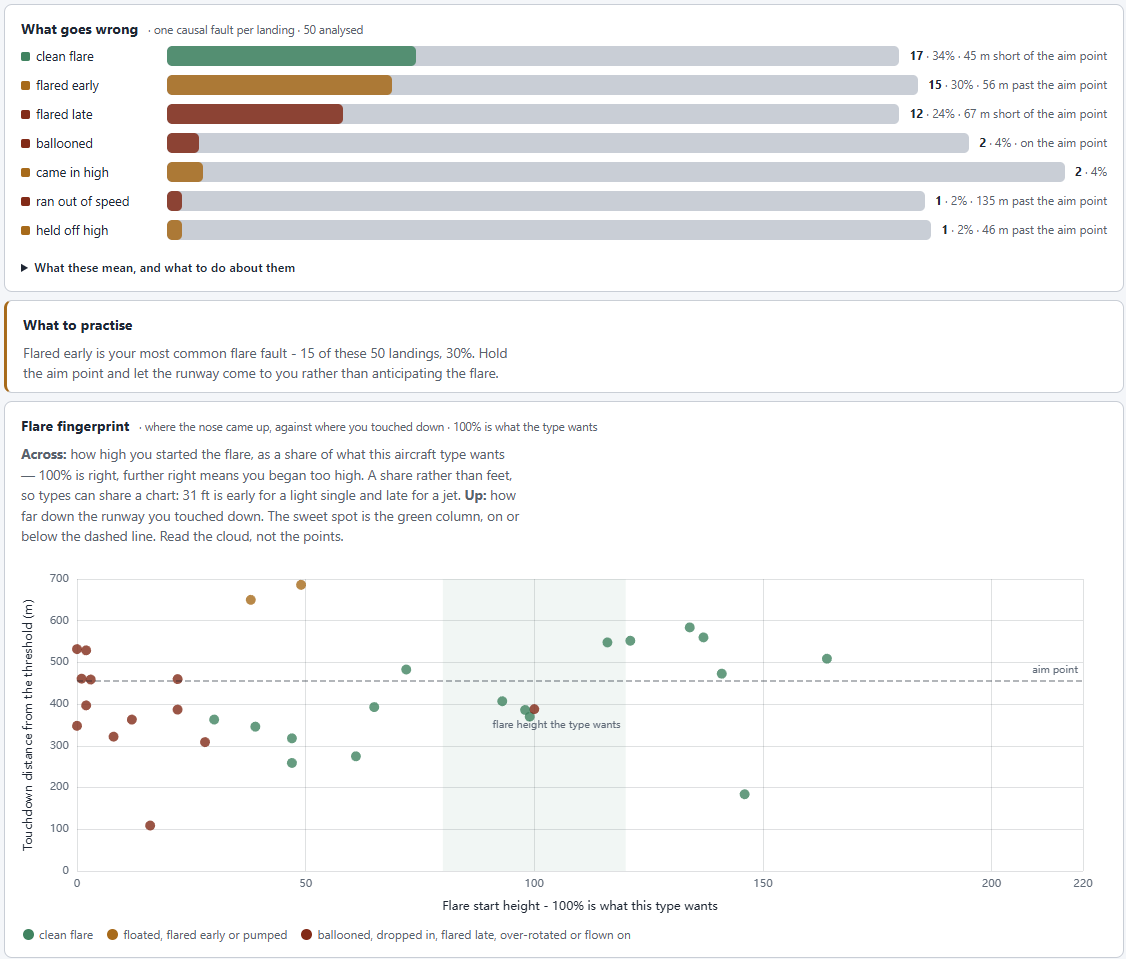
The multi-flight analytics live in Insights and this is the paid part of the product. The per-flight recording, scoring and reports are where to start, and the distributions become worth paying for once there are enough flights to draw them. The practical use of Insights is deliberate weakness targeting. Find the worst recurring sub-metric across your last few dozen landings and design sessions around only that, rather than flying whatever you feel like and hoping. Practice aimed by measurement beats practice aimed by mood, mostly because mood aims at what you already do well.
What the AI is for, and what it is not
Every flight gets an AI-written narrative, the landing gets an AI summary, stages get coaching notes, and Insights has a multi-flight coach. If the word "AI" makes you reach for the back button, first let me tell you how it works. All of it is generated from the flight's own recorded data, and its job is translation. A table of numbers, sink rate at the gate, speed delta at the threshold, lateral offset through rollout, is precise but requires an understanding of the data detail. The AI narrative turns the numbers into a debrief anyone can understand and act upon. It explains the data. It has no authority beyond the data, and it invents nothing that wasn't measured. Treat it as the instructor's verbal debrief of a flight the instructor actually watched.
What the flight simulator changes
Real-world landing advice silently assumes cues a flight simulator doesn't provide. Peripheral vision is the primary flare-height cue in real flying, the runway edges sliding outward in the corners of your eyes. A monitor's field of view compresses or removes it, so desk pilots substitute a learned sight picture, calibrated per aircraft and per camera position. That substitute works, but it's fragile. Change the FOV or the seat position and every judgement built on the old picture is wrong. A per-landing flare report is the only honest check on whether the substitute is currently working. Similarly, a spring-centred stick with no force feedback erases the softening control forces that tell a real pilot the speed is decaying in the flare, so the speed-versus-VRef data replaces a sense the hardware can't provide. Ground effect, incidentally, becomes significant within roughly one wingspan of the surface, which is why the flare feels so different in a light single with a 36 ft span and an airliner whose wing spans two hundred, and per-aircraft data beats any universal flare target for the same reason.
There is a compensating advantage, and it's a real one rather than a consolation. The simulator knows things no real cockpit records easily. Exact touchdown coordinates, instantaneous sink rate, lateral offset in feet, and a replay of what actually happened rather than what it felt like. A desktop landing report can be richer than the debrief a light-aircraft instructor can give, because the instructor was estimating and the simulator was sampling.
The logbook
Every flight joins your permanent logbook, statistics and personal world map. Flights in progress appear live on the map with a real-time HUD. Screenshots you take in the simulator upload automatically and arrive geotagged with the position, altitude, speed and heading at the moment you took them, which turns a folder of anonymous sunset shots into a record of where each one actually was. A flight can optionally be made public as its own shareable page even whilst the flight is in progress.
Getting started
Getting started takes about five minutes and it's free. Create an account, install the Client Connector on the Windows machine running your simulator, and fly. The flight logs itself, no preparation or buttons to click.
Fly from anywhere to anywhere, runways give you more accurate data, but land in a field and you will still get your flight recorded and scored.
Looking for somewhere new to fly, want to plan a multistage trip, use the Search to find your type of airport and then use the Simbrief integration to get a detailed plan.