
Density Altitude: Why Summer Makes Your Aeroplane Lazy
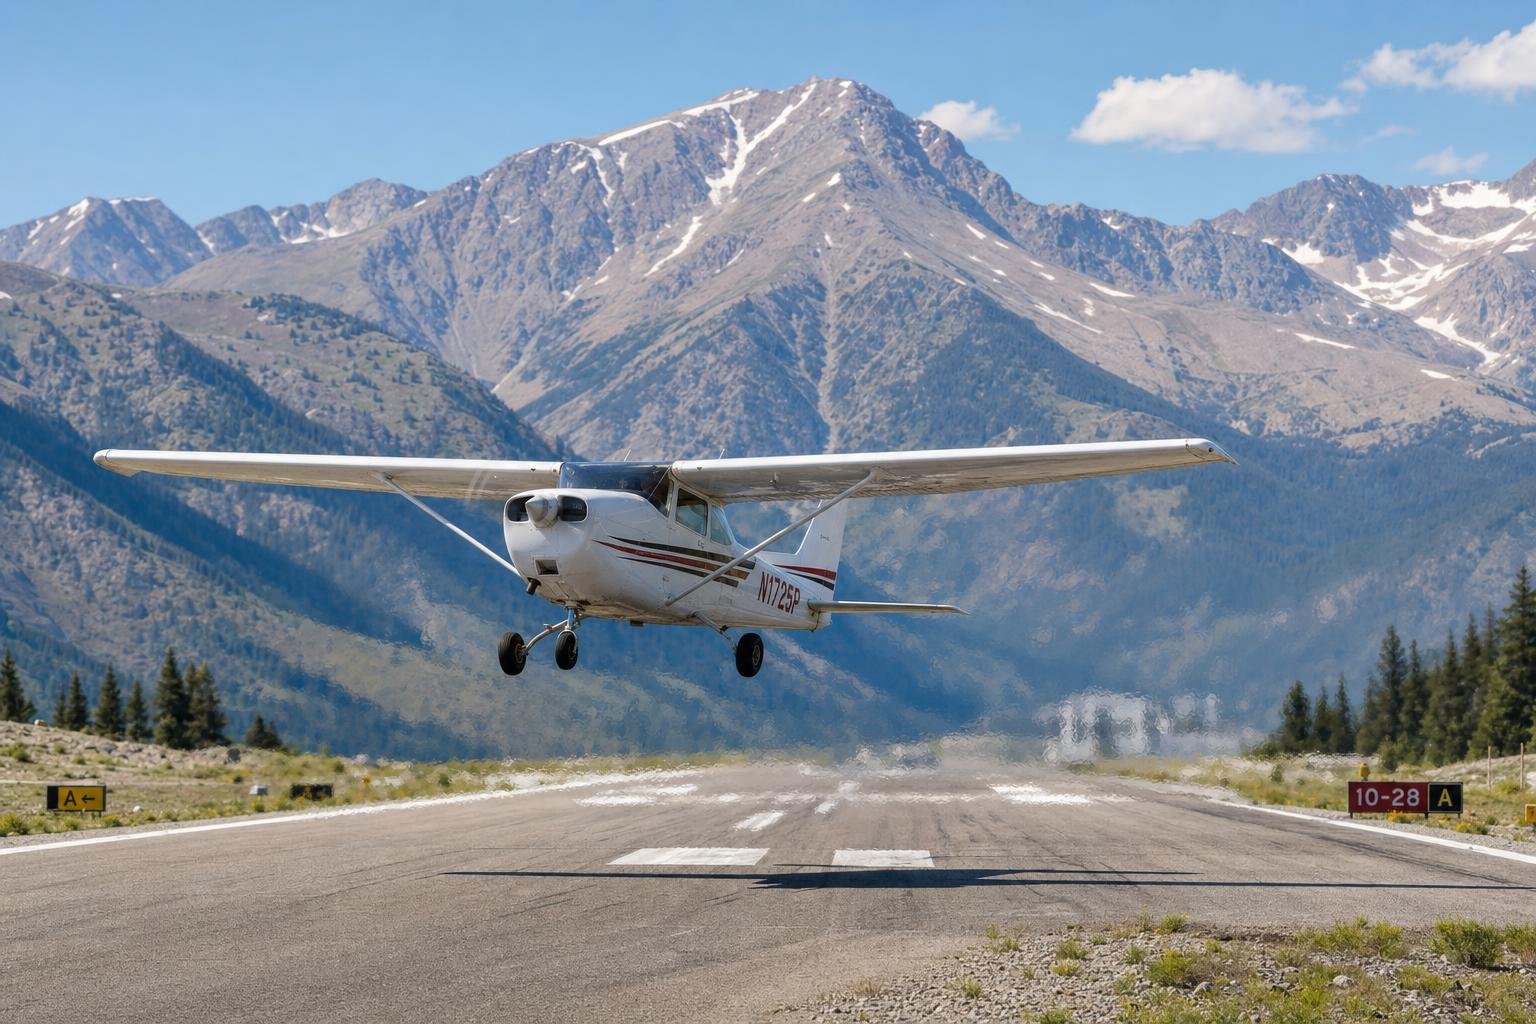
You fly a Cessna 172 out of a sea-level airfield 100 times and it behaves. Then you try a mountain strip on a summer afternoon, and it refuses to fly. The takeoff roll goes on forever, the rotation feels mushy, the climb rate is a fraction of what the aircraft "should" do, and half the time the session ends in the trees off the departure end.
What you've met is density altitude, and the reason it catches sim pilots in particular is that most of us have never actually flown a hot day. Default weather presets are temperate, and live weather is whatever today happens to be, so an ISA+30 departure is something you have to deliberately build. The community talks about density altitude constantly and experiences it almost never. In this article I want to explain what's actually happening, not with the usual list of effects but with the one mechanism they all fall out of, and then show you how to turn your simulator into the measurement tool no real-world pilot has.
The wing doesn't care
Start with the thing most explanations get backwards. Density altitude isn't an aerodynamic problem for the wing. It's a propulsion problem and a kinematics problem, and keeping those separate is what makes the whole subject predictable.
Lift depends on dynamic pressure, half the air density times the true airspeed squared. Your airspeed indicator measures exactly that quantity. So at the same indicated airspeed, the wing sees the same dynamic pressure, produces the same lift, stalls at the same indicated speed and handles identically, whether you're at sea level on a cold morning or at 13,000 ft of density altitude over Leadville. Nothing about the flare, the rotation attitude or the approach speed changes as an indicated number. If you fly the numbers, the wing will never betray you.
What changes is everything else.
The engine and propeller work on air mass. A normally aspirated piston engine burns air by mass, and thinner air means less mass per intake stroke. Worse, empirical fits for piston engines show power falling a few points faster than density itself, so a 25% loss of density costs more than 25% of your power. The propeller then takes its own cut. It's a wing too, generating thrust from the same thin air. A fixed-pitch propeller takes a second hit on top of that, because with less power available the engine can't spin it to rated RPM, so static RPM on the runup drops and the blade moves off its design point. A constant-speed prop flattens its blade angle and at least holds RPM.
The same indicated speed is now a faster true speed. True airspeed rises roughly 2% per 1,000 ft of density altitude for a given indicated speed. That sounds benign until you notice that every distance in flying is measured against the ground. Your rotation speed in true terms is higher, so the runway needed to reach it is longer. Your approach groundspeed is higher, so the float and the rollout are longer. Your turn radius, which goes with true airspeed squared, is larger for the same bank and the same indicated speed.
From those two facts you can rebuild every rule of thumb in the books, which is worth doing once, because a rule you can re-derive is a rule you can adapt.
Takeoff distance. Distance to reach a given speed is roughly the speed squared divided by twice the acceleration. The true speed squared grows as density falls, and the acceleration shrinks with thrust. Kinematics alone gives you about 6% more runway per 1,000 ft of density altitude, and the fact that engine power falls faster than density is exactly why the practical rule is 10% per 1,000 ft, not 6%. The extra four points are the engine, not the air.
Climb rate. This is where "lazy" comes from, and why the effect always feels out of proportion. Rate of climb is excess power divided by weight, and excess power is the difference of two large numbers. Power available falls with density. Power required actually rises, because drag at the same indicated speed is unchanged, but power is drag times true airspeed, and true airspeed is up. A 10% loss of power available can wipe out 30 to 40% of the climb rate, because you only ever get to keep the sliver between the two curves.
Here's the most useful single tool. Rate of climb falls roughly linearly from its sea-level value to zero at the absolute ceiling. If your aeroplane climbs at 700 fpm at sea level and has an absolute ceiling around 13,000 ft, then at 8,000 ft of density altitude it has about 270 fpm left. Two numbers, one straight line, and you can estimate climb performance at any density altitude without a chart.
Climb gradient. Terrain isn't cleared with rate. It's cleared with gradient, feet gained per mile travelled, which is rate of climb divided by groundspeed. At high density altitude the numerator shrinks and the denominator grows, so gradient degrades faster than rate. This is the divergence that hurts people, and there's more on it below.
Turns. Radius goes with true airspeed squared, so it grows roughly 4% per 1,000 ft of density altitude at the same indicated speed and bank. By 9,000 ft that compounds to around 40% more radius, with the same sight picture out of the window and nothing on the panel to warn you.
Landing. The flare happens at the same indicated speed and feels normal, but touchdown true speed is about 20% higher at 9,000 ft of density altitude, and kinetic energy, which goes with speed squared, is about 40% higher. There's no thrust term in the deceleration, so landing roll grows more gently than takeoff roll, roughly 3 to 4% per 1,000 ft, but the float in feet is longer and the touchdown point moves down the runway.
Two footnotes round out the picture. First, the altimeter consequence runs the other way. On a hot day the altimeter under-reads your true height, so terrain clearance actually improves while performance degrades. The dangerous version is the cold day, which is the mirror image and a subject for its own article on cold temperature altimeter error. Second, density altitude isn't purely a penalty. In the cruise it's free true airspeed, and the same indicated speed at ISA+20 gets you there sooner. The aeroplane is only lazy where excess power matters.
What a simulator removes, and what it gives back
Real-world density altitude teaching leans on a cue you can't have. The seat of the pants. "The aeroplane felt sluggish, it wasn't accelerating the way it should" is the earliest warning a real pilot gets, transmitted through the airframe into their body. At a desk there's no acceleration to feel, spring-centred controls carry no aerodynamic load, and a monitor with a default 60 to 70° field of view compresses peripheral motion so the runway appears to pass more slowly than it is. The exact cue you need is the one the screen damps. Widening the field of view, or flying in VR or with head tracking, restores some of it, but the sluggishness cue doesn't survive the trip to your desk and you need substitutes.
Two substitutes work, and both are better than the cue they replace because they're numbers rather than impressions.
The first is the 50/70 gate. Under constant acceleration you reach exactly 70.7% of your rotation speed at the halfway point of the roll, and since propeller thrust decays as speed builds, real acceleration is front-loaded, so you should be doing better than 70% at midfield. Pick a midfield reference on the runway before you roll. If you cross it below 70% of rotation speed, the physics is telling you the second half won't deliver what the first half did, and the abort is the right call. Failing this gate is a hard red flag, not a conservative one.
The second is the clock. Note your normal time from brakes-release to rotation on a standard day. It's one number, you already have it from 100 departures, and it stretches exactly when the runway does. Do density altitude work at normal simulation rate, because time acceleration preserves the physics but destroys the timing calibration you're trying to build.
Two settings quietly delete the whole lesson before you start. Auto-mixture removes leaning from the simulation entirely, and a pilot who has never turned it off has never flown a real high-density-altitude departure. Full rich at 9,000 ft of density altitude costs meaningful power, and the tell in the sim is a low static RPM on a fixed-pitch runup. Then there are the weather presets. "Clear skies" in most simulators is close to ISA, so the hot day must be built by hand. Set the temperature yourself. ISA+30 at a 6,000 ft field is a 10-second edit and a different aeroplane.
Set against those losses, the desk gives you 2 things no real cockpit has. Perfect repeatability, because the same aircraft, weight, runway and wind, with only the temperature changed, 10 minutes apart, is an experiment no real pilot on earth can run. And perfect measurement. Exact OAT, exact ground roll, exact rotation point, instantaneous gradient. Real-world density altitude teaching is chart-based because pilots can't measure. You can, so the practical half of this article is measurement-based instead.
One caution on fidelity. Ground roll accuracy depends on tyre friction, ground effect and propeller thrust modelling, which vary between simulators and between add-ons. X-Plane's blade-element propeller and MSFS's approach respond to density by different routes, and study-level add-ons usually model power lapse and mixture far better than default aircraft. Expect the trend to be right and the absolute distance to be approximate, and test your own installation rather than trusting a generic claim.
The arithmetic
Density altitude is pressure altitude corrected for non-standard temperature, the altitude at which the standard atmosphere would match today's air density. The standard atmosphere puts 15 °C and 1013 hPa (29.92 inHg) at sea level, cooling about 2 °C per 1,000 ft. The whole computation fits in your head.
- Pressure altitude ≈ field elevation + 30 ft for every hPa the QNH sits below 1013 (or 1,000 ft per inch below 29.92).
- Density altitude ≈ pressure altitude + 120 ft for every °C the actual temperature sits above ISA for that altitude.
Both are linear approximations, good in the altitudes where you fly. I'll work it once. Denver sits at about 5,400 ft, where ISA temperature is around 4 °C. On a 35 °C afternoon that's ISA+31, so add roughly 3,700 ft, call it 9,100 ft of density altitude. Leadville, the highest public-use airport in the United States at just under 10,000 ft, reaches about 13,500 ft of density altitude at a mere 25 °C, which is close to the absolute ceiling of a fully loaded 172, and that's why the aircraft that "flew fine yesterday morning" won't leave ground effect this afternoon.
And elevation isn't required. Phoenix sits at about 1,100 ft, and at 47 °C its density altitude exceeds 5,000 ft. A Gulf-coast field at sea level on a 45 °C day is a 3,500 ft airport, before you count humidity. Moist air is less dense than dry air, because water vapour displaces heavier nitrogen and oxygen, and on a saturated tropical day that's worth several hundred feet of additional density altitude on top of what the temperature already did.
The per-1,000-ft numbers to memorise, all for light piston aircraft on dry, level, paved runways.
| Effect | Per 1,000 ft of DA |
|---|---|
| Takeoff distance | +10% |
| Landing ground roll | +3 to 4% |
| True airspeed at fixed IAS | +2% |
| Turn radius at fixed IAS and bank | +4% |
| Climb rate | use the linear-to-ceiling method |
The takeoff figure compounds multiplicatively, and that catches people. 5,000 ft of density altitude is 1.10⁵, about 1.6 times the book distance, and 9,000 ft is well over double. A headwind helps less than you expect up high, too. The benefit scales with the headwind as a fraction of rotation speed, and rotation speed in true terms has grown, so 10 knots buys a smaller percentage at Leadville than at sea level.
One trap in the paperwork. POH takeoff and climb charts are entered with pressure altitude and temperature, not with density altitude. The chart does the density correction internally. Entering density altitude double-counts the temperature and gives you numbers that are wrong in the comforting direction. Reading and using a POH performance chart properly is its own subject. The short version is to give the chart what it asks for.
Where it actually bites
The failure modes are worth naming individually, because the fixes for some of them are opposites and the first job is knowing which one you have.
Rotating on the sight picture instead of the ASI. The runway is disappearing faster than feels right, so the pilot pulls at the usual point on the runway rather than the usual indicated speed. Angle of attack and drag rise, the aircraft staggers into ground effect and settles back on. From the cockpit it reads as "the aeroplane feels heavy". Pitch comes up, the IAS stops building, the VSI wanders around zero. The wing was never the problem. It was asked to fly below its speed.
The mirror error. Refusing to rotate because "it isn't ready", holding the aircraft on past rotation speed, and running out of runway 5 knots above Vr. Same outcome, opposite cause, opposite fix. This is why the diagnosis matters more than the rule.
Climbing at the sea-level Vy. Best-rate speed decreases with altitude while best-angle increases, the two converging at the absolute ceiling. At high density altitude a 10-knot speed error costs a large fraction of an already small excess power. Being off-speed matters most precisely when you can least afford it.
Adequate rate, inadequate gradient. This is the one the VSI hides. 400 feet per minute looks flyable, and at 100 kt of groundspeed it's 240 ft per nautical mile, which is below plenty of published departure gradients and below plenty of valley floors. The VSI is the wrong instrument for a mountain departure. Feet per mile is the number that clears rock, and the sim will show it to you exactly.
The valley turn that no longer fits. Same bank, same indicated speed, same picture out the window, 40% more radius at 9,000 ft of density altitude. Mountain flying technique, ridge crossings, downdrafts, the box canyon escape turn, is its own discipline and its own article, but the radius arithmetic belongs here, because nothing on the panel announces it.
Assuming the equipment exempts you. A turbocharger restores manifold pressure up to its critical altitude and restores nothing else. The propeller still bites thin air, true speeds are still higher, the ground roll still grows. Roughly half the penalty remains. A jet or a "powerful" add-on changes the engine story, not the kinematics.
The landing nobody budgets for. The approach and flare feel normal because they're flown on indicated speed, but the float is longer in feet, the touchdown point moves, and the rollout carries roughly 40% more energy into the brakes at 9,000 ft of density altitude. Pilots who nail the touchdown rate still go off the far end. At one-way strips like Aspen or Courchevel, where terrain or gradient removes the go-around, the margin has to be found before the threshold, not after it.
Blaming the flight model. The most common sim-specific failure. A pilot who has never flown a hot, high departure suddenly can't climb and concludes the add-on is broken. The diagnostic is below, and it takes an hour.
Different machines fail differently
Normally aspirated piston singles are the worst case, losing engine power, propeller thrust and excess power at once. Turboprops fail on temperature rather than density directly. On a hot day the limit arrives as an ITT or torque ceiling, abruptly, rather than as a gradual slope. Jets are flat-rated, broadly indifferent to temperature up to a corner point somewhere above ISA, then losing thrust steeply beyond it, which is why airline hot-and-high performance is a table lookup rather than a feel, and why the binding constraint on an airliner is usually the engine-out climb gradient rather than the runway length. If you fly the Fenix or the PMDG, you already do density altitude arithmetic on every departure without naming it. A FLEX or assumed-temperature takeoff is the density altitude equation run backwards. You tell the engines it's hotter than it is so they produce exactly the thrust the runway requires. Helicopters are the extreme case, with hover performance out of ground effect collapsing first. MSFS 2024 pilots discovering high-altitude helipads will meet that quickly, and it deserves its own article.
Across all of them, weight is a multiplier, not an addition. The same 200 lb of payload that costs a barely measurable percentage at sea level can be the entire climb margin at 9,000 ft of density altitude, which is also why sim pilots' habit of flying at default or zero payload quietly hides the whole subject.
What transfers to a real cockpit, and what doesn't
The arithmetic transfers completely. So do the habit of computing density altitude before every departure, the distinction between rate and gradient, the 50/70 gate, and the turn-radius awareness. That last one is pure kinematics and identical in the aircraft. Abort decision-making transfers unusually well, because the sim lets you practise the decision hundreds of times, where a real training programme might give you 2.
Three things don't transfer, and one of them transfers negatively. Anything that depends on feeling acceleration or the aircraft going light on the wheels stays at the desk. If you fly with auto-mixture on, the sim is actively training you not to lean, and a full-rich departure from a high field is a real hazard in a real aeroplane. And free resets teach that an abort costs nothing, when in reality brake energy, tyres and consequences bias real pilots toward continuing, which is the exact bias that produces the accident reports.
Stop quoting the rule and measure your aeroplane
The 10%-per-1,000-ft rule exists because real pilots can't run controlled experiments. You can, and using the generic rule when you could have your own numbers is a substitute for measurement dressed up as airmanship. The core drill is the ladder. Same aircraft, same weight, same runway, zero wind, and fly the departure at density altitudes of roughly 0, 3,000, 6,000, 9,000 and 12,000 ft, changing only the temperature. Record ground roll, time to rotation and time to 500 ft above the field. In under an hour you have a performance chart for your specific aircraft in your specific simulator, and a diagnostic with it. If the ground roll grows smoothly at roughly the compounding rate above, the flight model is behaving. If the line is flat, the add-on isn't modelling density properly, and you should know that before trusting anything else it tells you.
Worth adding around the ladder. An A/B pair at ISA and ISA+30 10 minutes apart, which isolates the effect completely. A climb to the absolute ceiling on a standard and a hot day, which anchors the linear climb-rate rule for your type. A mixture A/B at a high field with assists off, measuring the ground-roll cost of full rich instead of reading about it. And the same 180° valley turn flown at sea-level and 9,000 ft density altitudes, watching the same sight picture stop fitting. Vary the airport, weight and temperature between repetitions rather than grinding one scenario, because what you're building is a judgement that generalises, not a memorised departure. And every repetition must produce a recorded number, because a drill you don't measure is just flying.
The record-keeping is where doing this by hand collapses. Nobody writes down 30 ground rolls. This is the specific problem I built My FS Flights for. It logs the whole flight automatically and produces a takeoff report and a landing report for each one, so the ladder leaves 5 directly comparable scored records instead of 5 impressions. The landing report's rollout section is where high-density-altitude landings actually show up, while threshold speed against VRef is an indicated-speed metric and should be completely unaffected by density altitude. So if your VRef margin creeps up on hot days, that's your hand responding to the faster ground picture, not physics, and it's only visible across many logged flights. The platform doesn't compute density altitude for you. What it does is measure the consequences, which is the half of the problem you can't do in your head.
The patterns that matter most only exist in aggregate anyway. A tendency to rotate early on hot afternoons, consistently long landings at high-elevation fields, a quiet preference for the runway that happens to be downhill. No single flight contains them and no memory holds a season of them.
If you take one action from this article, make it this. Build an ISA+30 weather preset tonight, take your usual aircraft to a 6,000 ft field, and fly the departure once with the OAT set to standard and once with it set hot. The second takeoff will teach you more about density altitude than everything you've read about it, this page included.